top of page


5 Common Business Intelligence (BI) Myths — Debunked (With Help from DataRoars)
Business Intelligence (BI) has become one of the most talked-about technologies in business today — and for good reason. When used well, BI helps companies understand trends, make smarter decisions, and unlock real business value from data. Yet despite its popularity, there are still plenty of myths and misconceptions that hold teams back from truly capitalizing on their data. Let’s explore five of the most common BI myths , clear up the confusion with real insight, and show
archit032
Jan 273 min read


Dashboard Adoption: 7 Tips to Get Your Team on Board
In today’s data-driven world, building a dashboard is only half the battle — the real challenge is getting people to use it. With Power BI, organisations have powerful tools at their disposal — but many dashboards end up underused, ignored, or gathering dust. To avoid that fate, you need deliberate strategies that address not just the technical build, but human behaviour, culture, and continuous engagement. Here are 7 practical tips to help ensure your team adopts and relies
archit032
Jan 104 min read


SEO Analytics Dashboard: Track Your Website’s Success in One View
In an era where data-driven decisions are essential for digital success, having a unified view of your website’s SEO performance is not just convenient — it’s critical. An SEO analytics dashboard offers a clear, real-time picture of how your website is doing in search engines and user engagement. This blog explores why an SEO dashboard matters, what key metrics and insights it should deliver, and how Power BI can be the foundation for building such a dashboard — giving you co
archit032
Jan 108 min read


Maximizing QuickBooks Data: Financial Dashboards for SMEs
Small and medium-sized enterprises (SMEs) often rely on a robust accounting platform like QuickBooks to manage their finances — tracking revenue, expenses, invoices, payments, cash flow, and more. But raw financial data, stored in accounting ledgers, is only the beginning. To make informed, strategic decisions, SMEs need visibility: dashboards that convert disparate data into actionable insights. This is where Power BI comes in — enabling businesses to transform their QuickBo
archit032
Jan 86 min read


Building a Winning Sales Dashboard: Essential Predictive Analytics Components
Predictive analytics turns raw sales data into insights that help you understand customer behavior, predict revenue, and find opportunities before they disappear. In the case of a sales dashboard , predictive analytics goes beyond looking at past data to figure out what will happen next and why it matters for your profits. You need predictive analytics because guessing doesn't work on a large scale. Sales teams that rely on intuition or old spreadsheets miss important patter
archit032
Jan 57 min read


Maximize Your Dashboard's Potential: Maintenance Tips for Fresh Insights
Introduction Power BI is a powerful platform that allows you to turn raw data into engaging visual stories. With Power BI, you can easily connect to various data sources, create interactive reports, and share insights with your organization. But building a dashboard is just the first step. Without proper maintenance, even the best-designed dashboards can become useless. Outdated data can lead to wrong decisions, broken connections can cause confusion, and old metrics may not
archit032
Jan 39 min read


Unlock the Power of Agile Analytics: Quick Dashboard Implementation
In today's data-driven world, organizations collect a lot of information but often struggle to turn it into useful insights quickly. Traditional methods of analyzing data can take months to produce reports, which means by the time they're ready, business needs may have already changed. Agile Analytics is a new approach that solves this problem. It focuses on working together and being flexible, allowing us to create dashboards in 4 weeks or less. This way, we can make import
archit032
Nov 1, 20259 min read


From Excel to BI: Transforming Data Wizards into Business Intelligence Heroes
Introduction You've built your career mastering Excel formulas, pivot tables, and VLOOKUP functions. You're the go-to person when colleagues need data insights. But here's the reality: the data landscape has evolved , and Excel alone can't keep pace with modern business demands. The shift from Excel-based data analysis to Business Intelligence platforms isn't just a technology upgrade—it's a fundamental transformation in how organizations extract value from their data. Conver
archit032
Nov 1, 20259 min read


Analytics Project or Product? Discover the Best BI Engagement Model
Business Intelligence (BI) turns raw data into useful information that helps your organization make strategic decisions. You use BI...
archit032
Oct 8, 20259 min read


Designing Dashboards Users Actually Love: The UX in BI Guide
UX in BI is where user experience design meets business intelligence, creating dashboards that make complex data easy to understand and...
archit032
Oct 3, 20259 min read


Case Study: Loading Multiple Excel Files (Non-Standardized & Standardized Combined) in Power BI
Context The client had a mixed bag of Excel files: Some with standardized column structures. Others with completely different formats....
archit032
Sep 29, 20252 min read


Small Business, Big Insights: Affordable BI Solutions Overview
Business Intelligence (BI) turns raw data into actionable insights that drive strategic decisions. You no longer need enterprise-level...
archit032
Sep 26, 202510 min read


Data Security in BI: 5 Essential Tips to Keep Your Dashboards Compliant
Data security in BI dashboards has become a critical business imperative as organizations increasingly rely on business intelligence...
archit032
Sep 20, 20258 min read
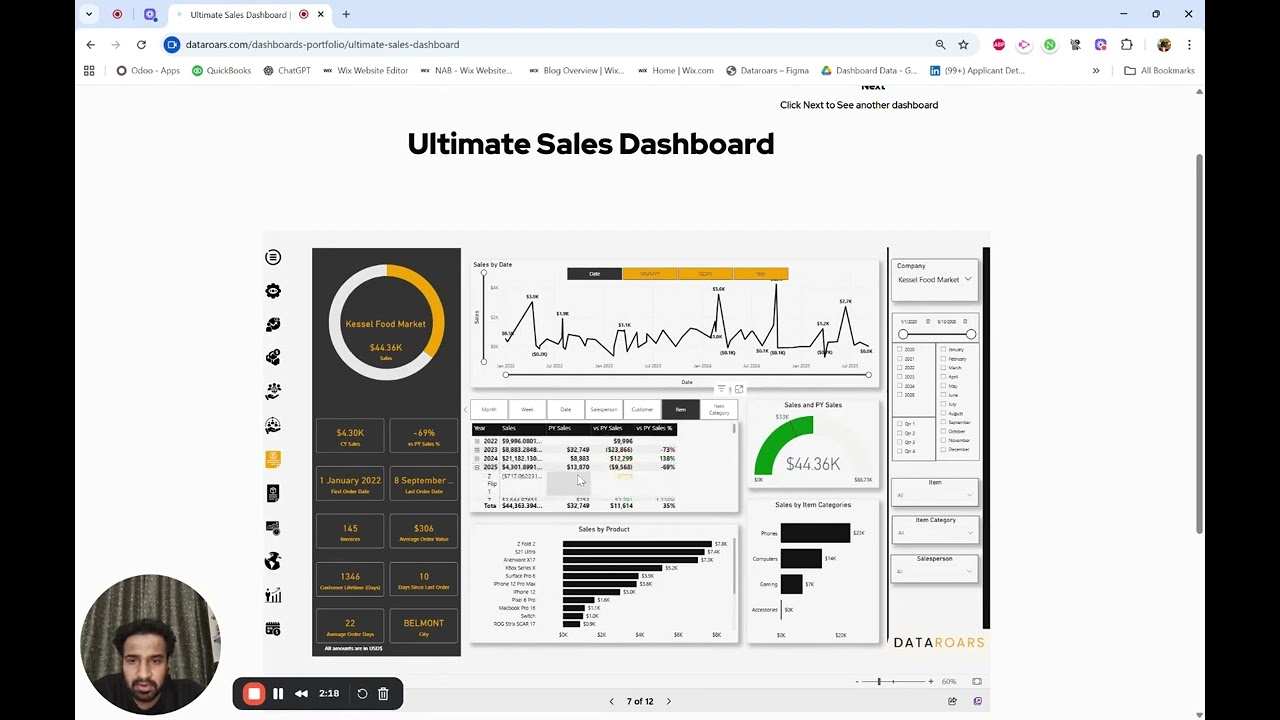
Case Study: Maximizing Sales with the Ultimate Sales Dashboard
In this video, I discuss how my ultimate sales dashboard can significantly enhance sales growth by providing actionable insights. I highlight the importance of focusing on customers who have experienced a sales decline of over 20%, such as KSL Foods, and how we can directly reach out to them to understand the reasons behind this drop. By analyzing specific items that are no longer selling well, I emphasize the need to identify trends and adjust our strategies accordingly.

nitin rungta
Sep 18, 20252 min read


Choosing the Right BI Tool: Tableau vs Power BI vs Domo vs Custom
Business intelligence tools have become essential for modern organizations, turning raw data into actionable insights that inform...
archit032
Sep 5, 20255 min read


The ROI of BI: How Dashboards Save Time and Money
Business intelligence dashboards are essential tools for modern organizations. They turn raw data into valuable insights using...
archit032
Aug 29, 202510 min read


How to Enhance Your CRM with a Custom Analytics Dashboard in 5 Easy Steps
In today's data-driven business world, your CRM system holds valuable insights waiting to be unlocked. A custom analytics dashboard...
archit032
Aug 22, 20256 min read


How an Inventory Management Dashboard Can Help You Avoid Stockouts
An inventory management dashboard is like a control center for your business's stock management. It gives you a powerful digital tool to...
archit032
Aug 7, 20256 min read


The Battle of Productivity: Excel vs. Real-Time Dashboards
In today's data-driven business world, choosing the right visualization tool can greatly affect your productivity. Excel, Microsoft's...
archit032
Aug 4, 20258 min read
bottom of page